Monitoring
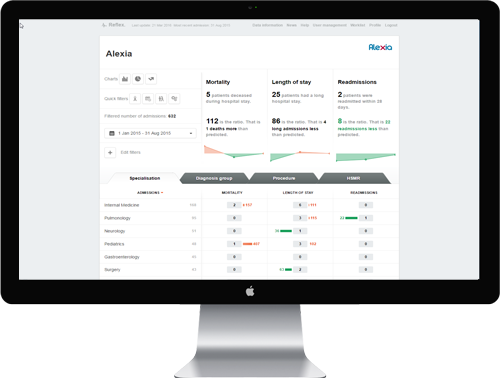
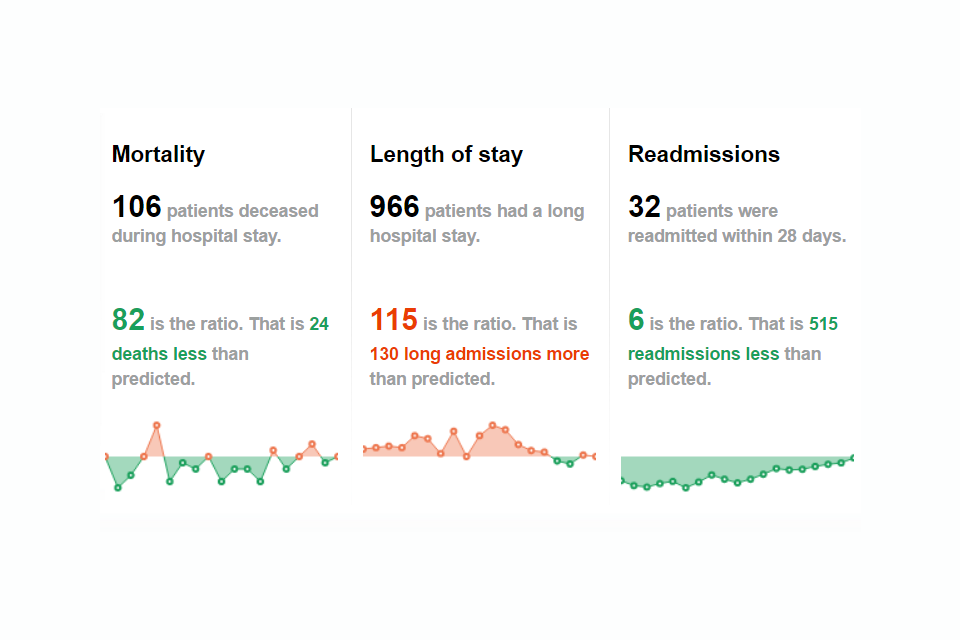
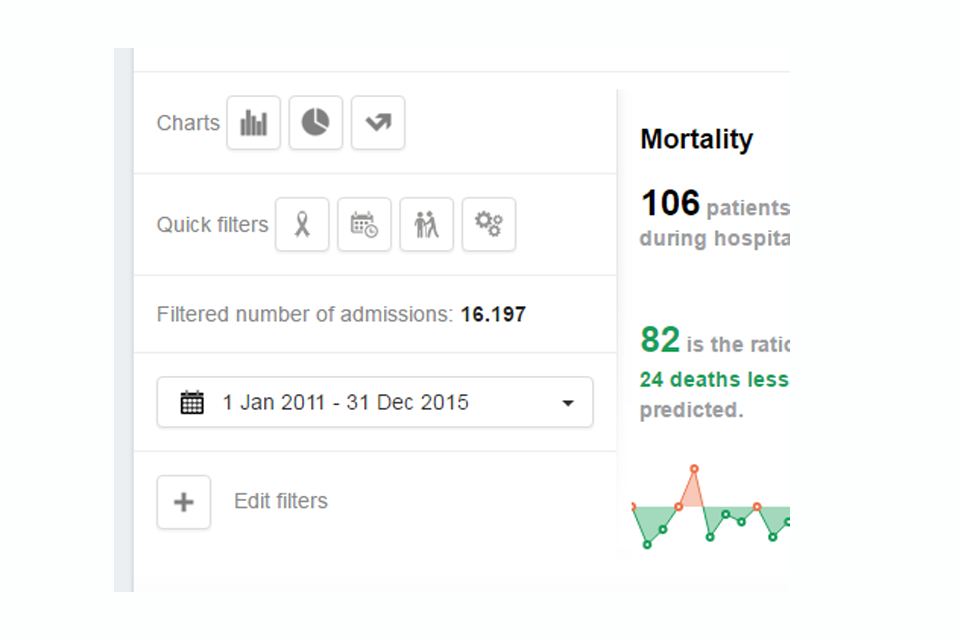
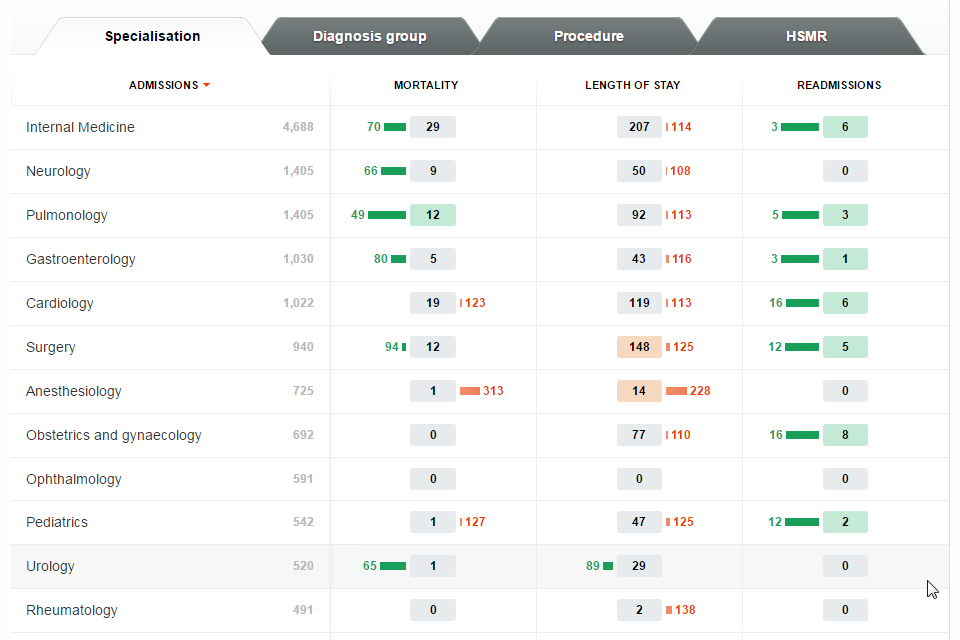
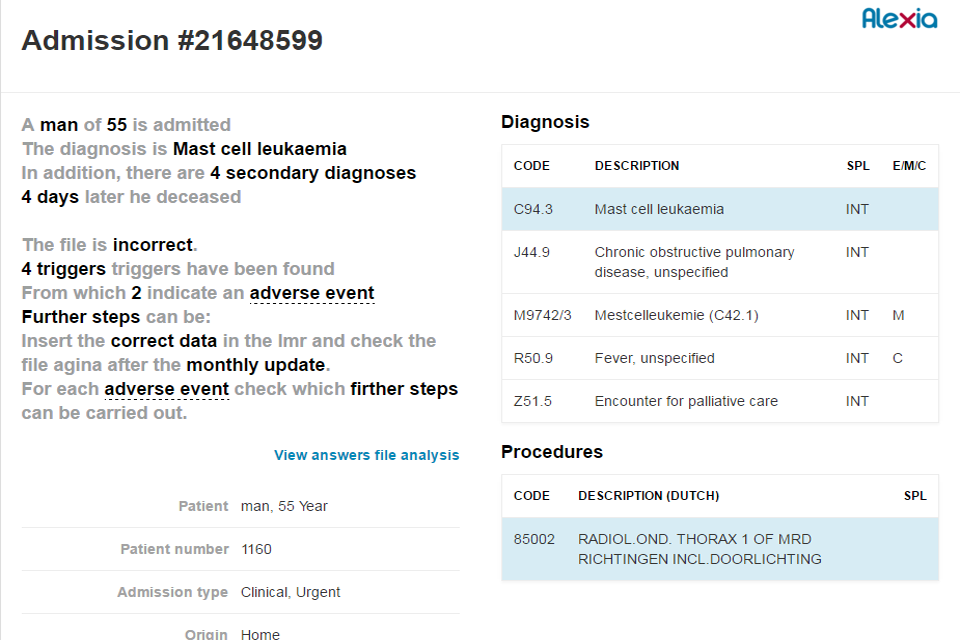
The starting point for the data analysis is the outcome of each admission. The indicators are mortality, readmissions and long stays. The visualization of these indicators is provided in detail, given the specialties, diagnosis groups and procedures. The system also incorporates a number of filters like age, gender and urgency.
Visualization
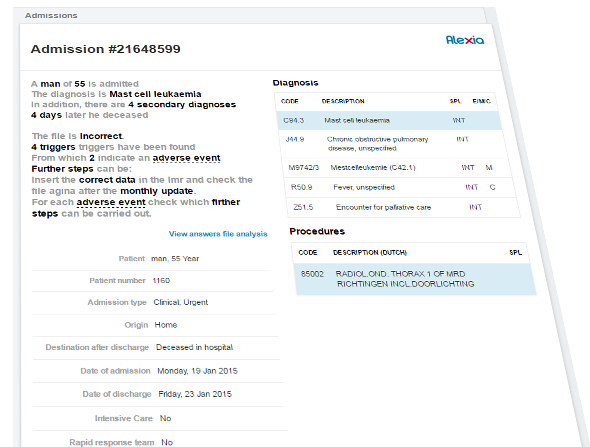
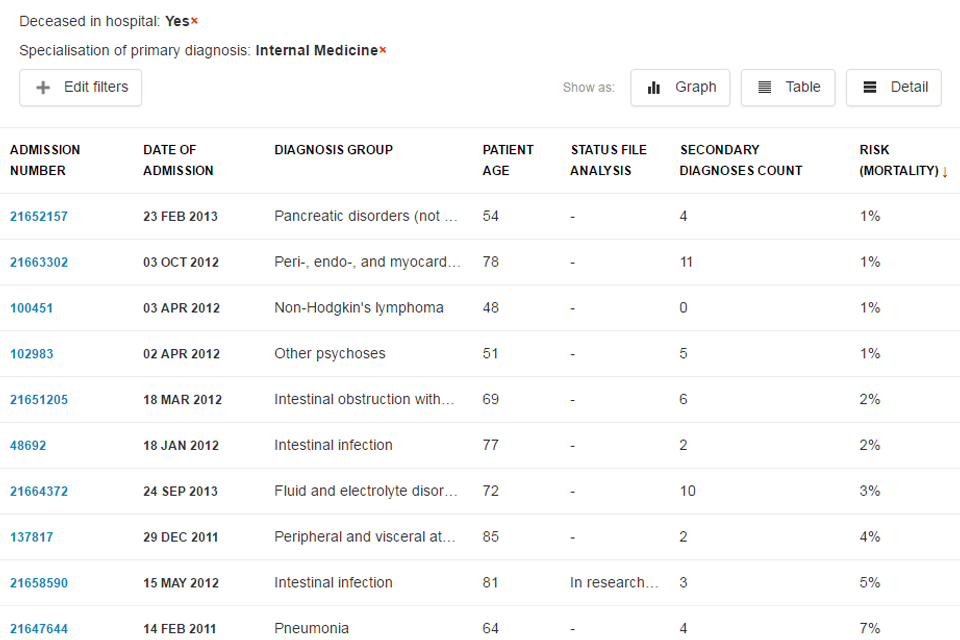
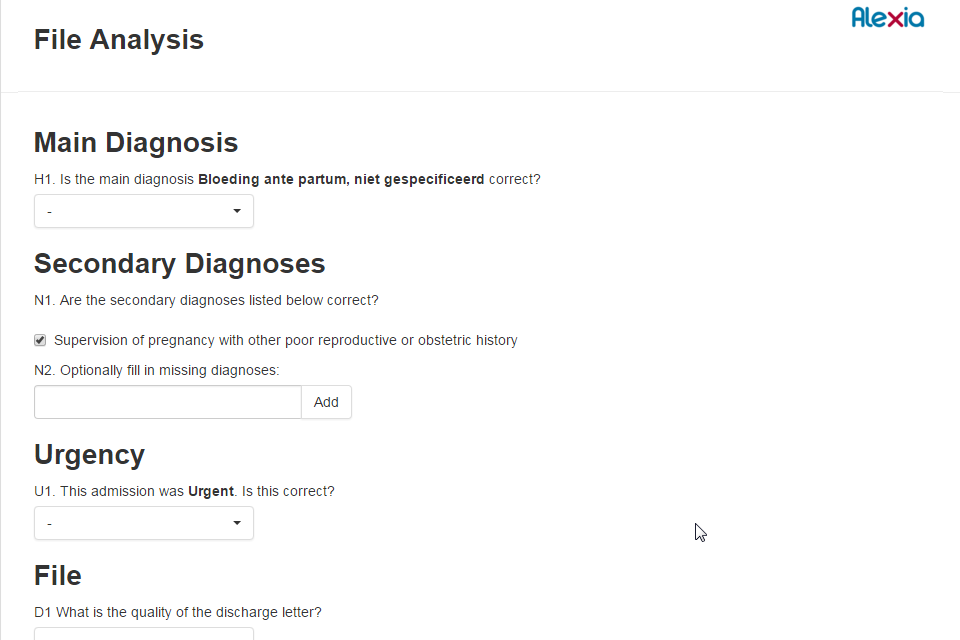
Comparison between the expected and observed outcomes are the starting point for exploring underlying causes. Reflex can rank admissions using specific filters, for instance patients with unexpected long stays. From this, necessary improvements can be identified.
Benchmark
The data generated by Reflex can be benchmarked against data from other hospitals (where available), regional or national averages, other countries and so on. There are numerous possibilities for identification of improvement areas and best practices.
Optimized financial performance
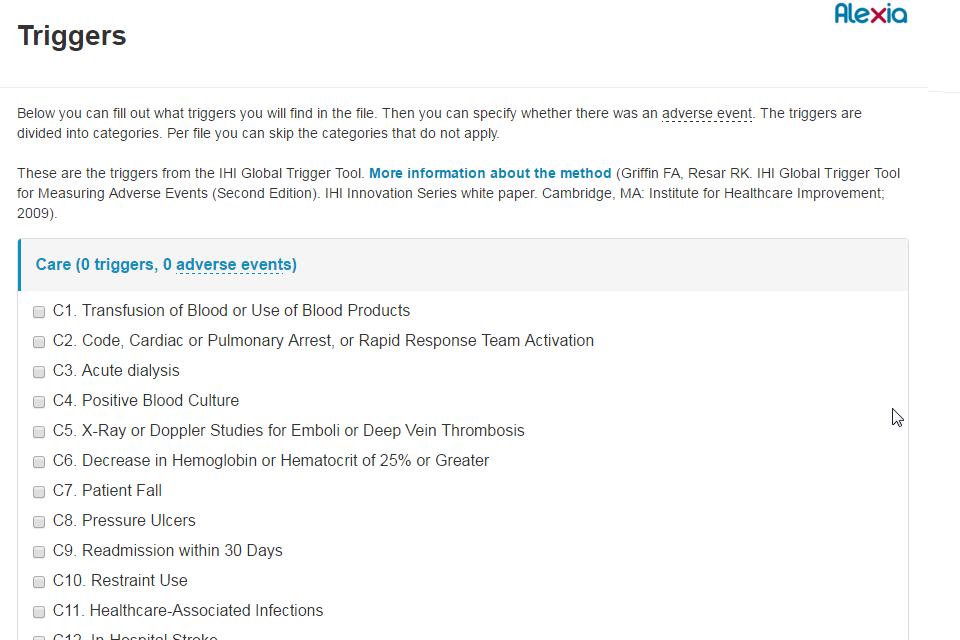
Identifying factors to be improved can lead to better management of human and financial resources. For example, imagine how much time of doctors, nurses and technicians is wasted re-coding patient information? What about the costs of avoidable adverse events? Better allocation of such resources can lead to visible changes in results.
Quality cycle
After selecting cases for detailed review and identifying factors that need change, managers can build a quality and monitoring cycle. This can be applied in both medical services and managerial/financial performance. In addition, when an improvement is made, its effects can be monitored in the same system.
The more the data is used, the better, more precise and reliable it becomes over time.