Impression What do we present
Overview of outcomes
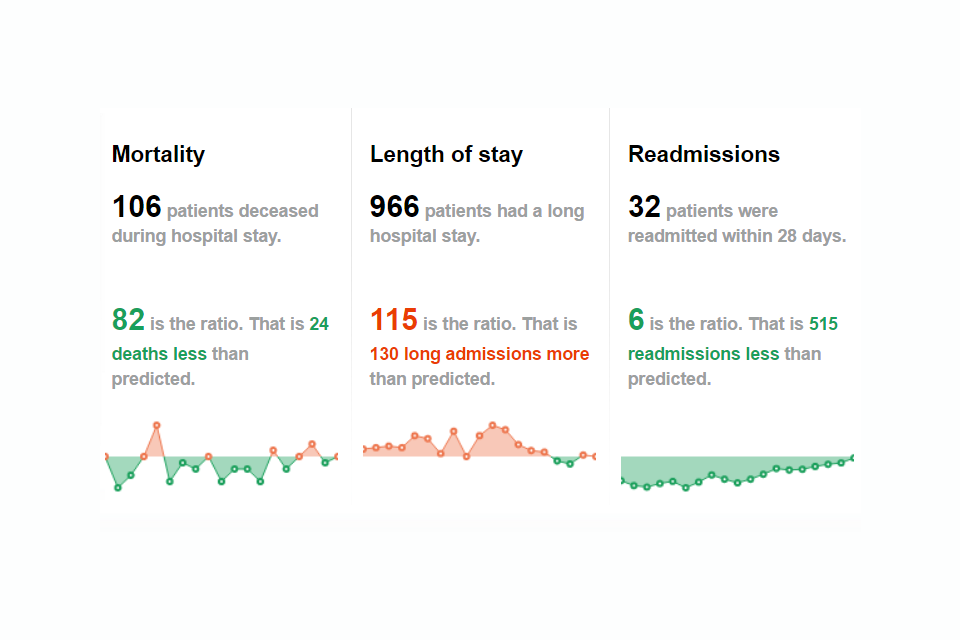
Three outcome indicators are presented in one overview. The number of patients is presented as well as the ratio (SMR).
Outcomes
- Mortality (HSMR)
- Long length of stay
- Readmissions
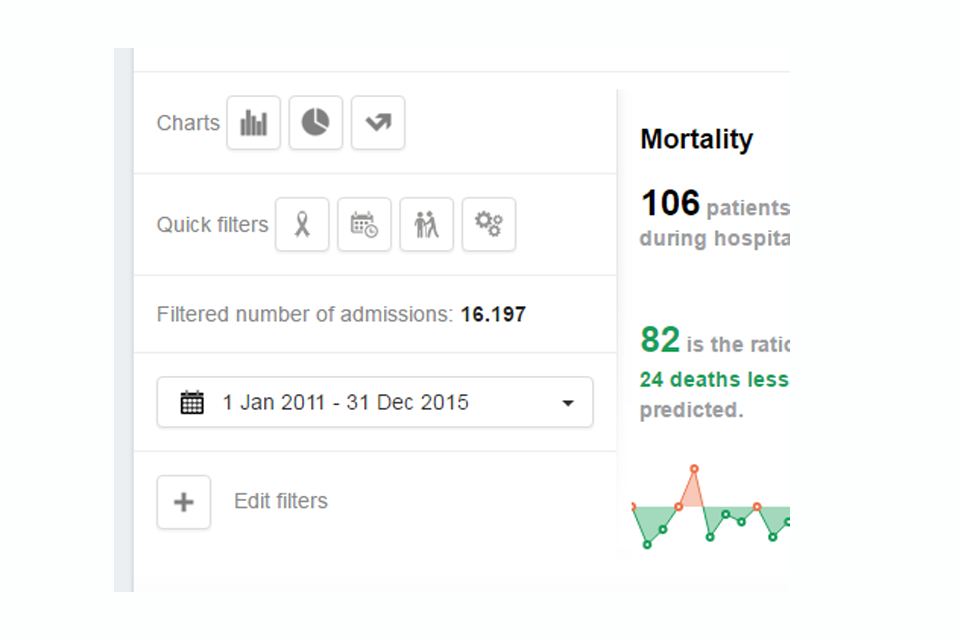
Filters
Reflex contains many filters. This makes it easy to breakdown to the outcomes of a specific patient population.
Examples of filters
- Time period
- HSMR diagnoses
- Specialism
- Referral (home, other hospital, …)
- Patient ID
- Day of admission
- Discharge destination
- Evening, night and weekend
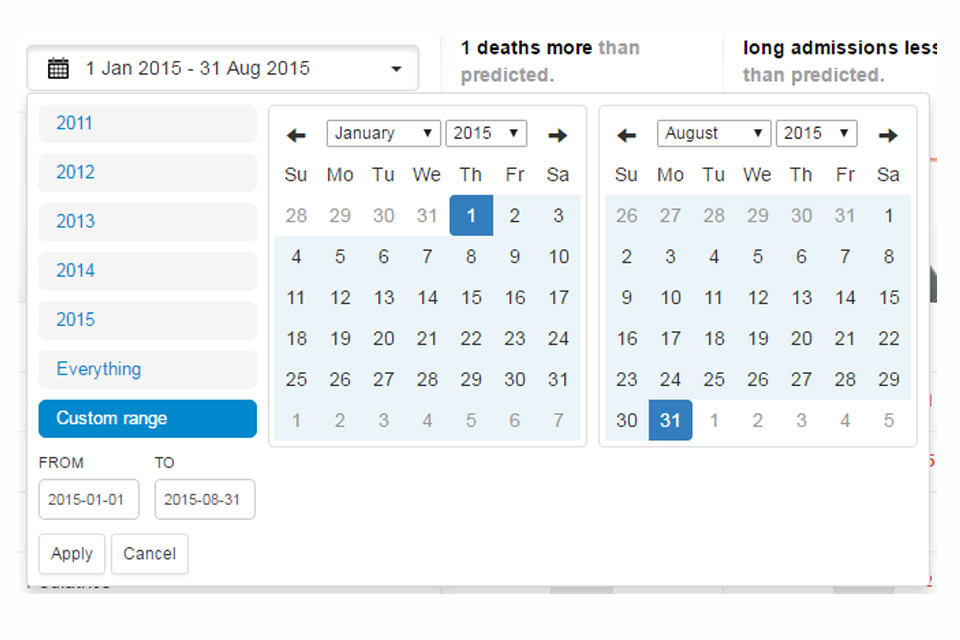
Filter on specific date
Choose a period you want to analyse.
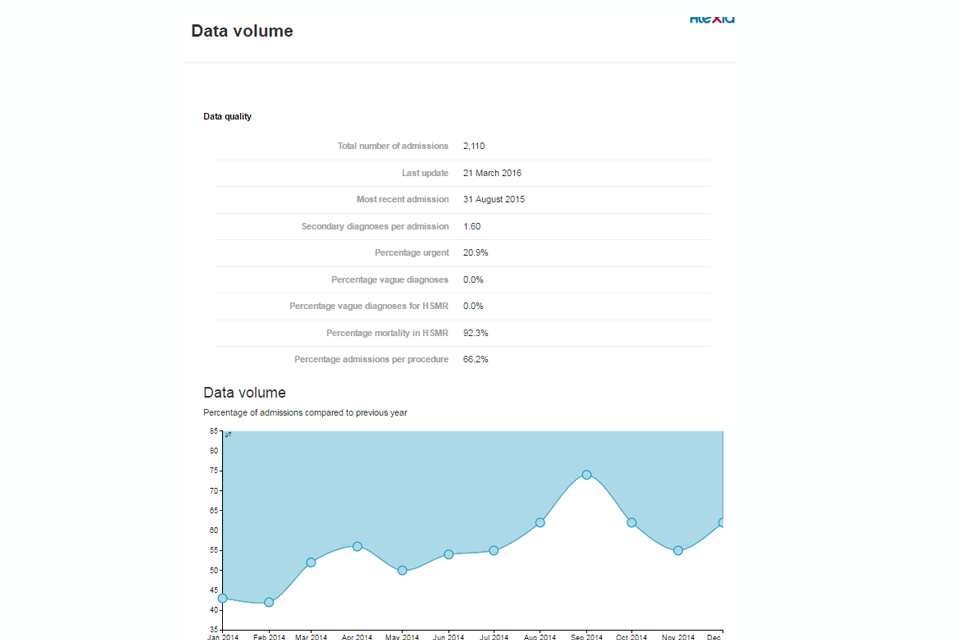
Data volume and quality
How many admissions are in the analysis. What's the delay in registration of admissions? For every filter, the datavolume can be shown. Not only the datavolume is shown, but also several indicators of data quality.
Data quality
- Most recent admission in analysis
- Number of secondary diagnoses
- Percentage of urgent admissions
- % vague diagnoses codes
- % vague diagnoses for HSMR calculation
- % mortality in HSMR admissions
- % admissions with procedure
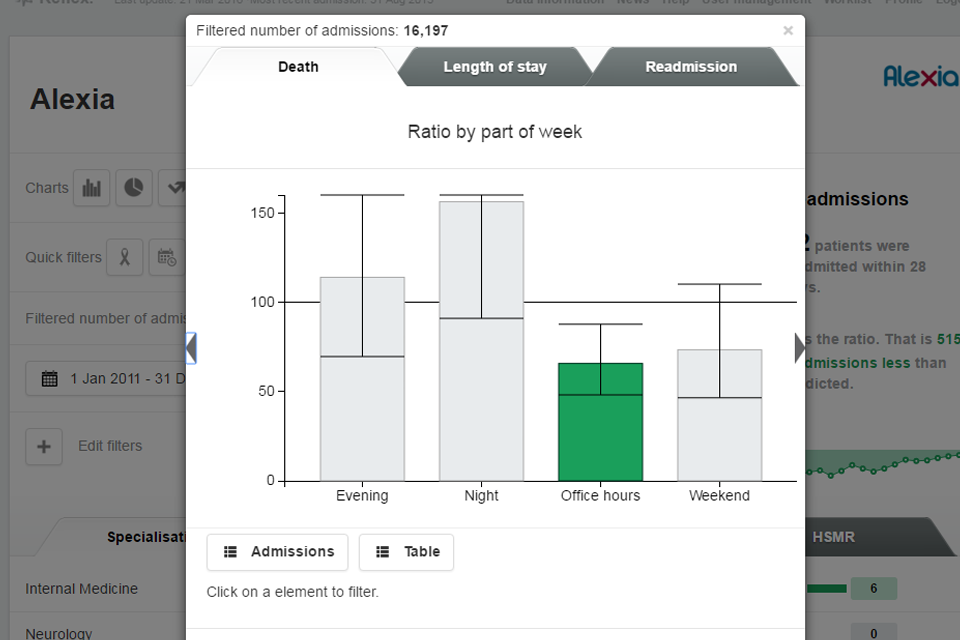
Drilldown to categories
This provides the opportunity to focus on a specific topic and visualize deviations. This is possible for mortality, long length of stay as well as unplanned readmissions.
Breakdowns
- Age
- Urgency
- Day, evening, night
- Workweek, evening, night, weekend
- Day of the week
- Patient referral
- Number of secondary diagnoses
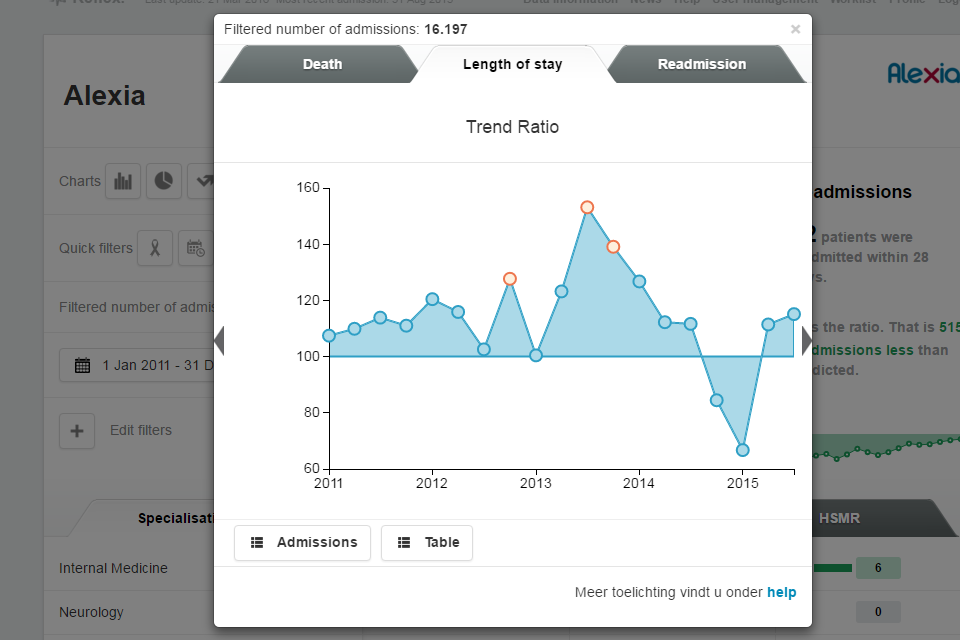
Trend analysis
Het volgen van trends in de tijd laat u zien hoe een bepaalde indicator zich ontwikkeld. Deze functie is ideaal voor het monitoren van de effecten van een genomen besluiten of projecten op de kwaliteit van de zorg.
Trends
- Ratio
- Number of deaths
- Number of long length of stay
- Number of unplanned readmissions
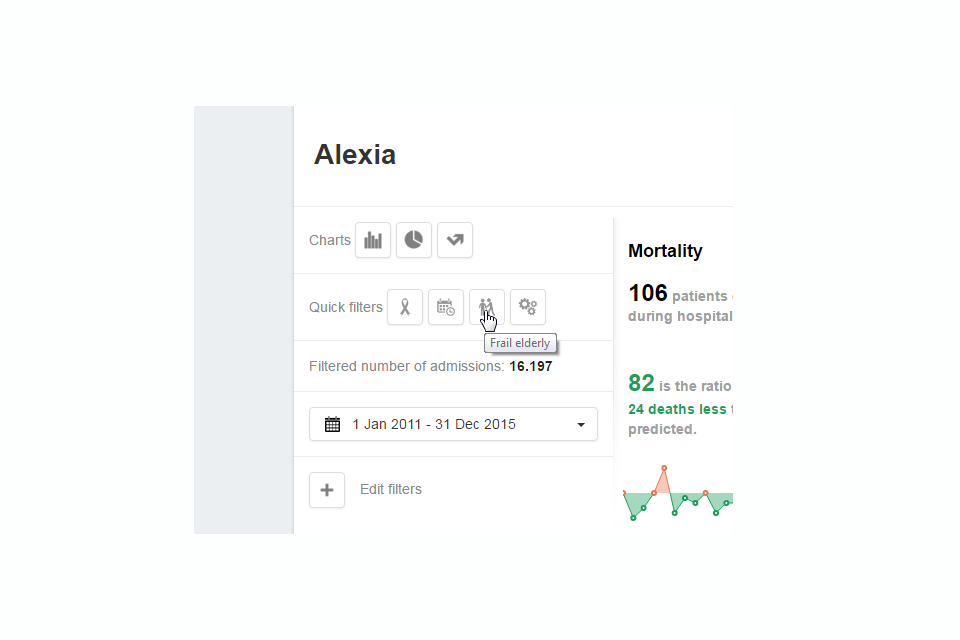
Predefined filters
Directly drill down to specific patient groups
Build-in:
- Oncology: select admissions with cancer and/or metastases
- Part of week: select admissions at evening, night and weekend
- Frail elderly
- Complications
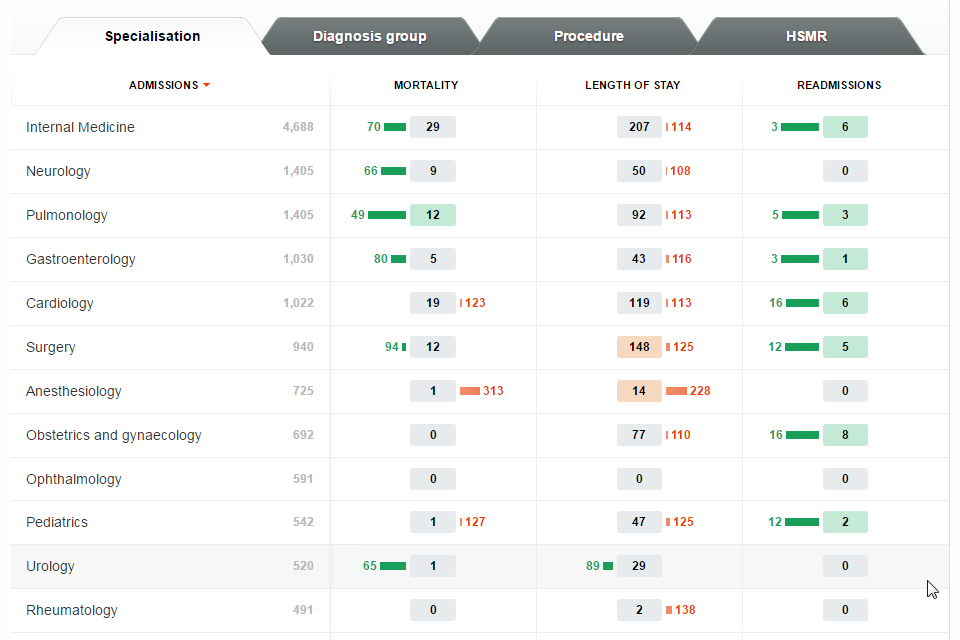
SMR's per specialty
Outcomes for mortality, long length of stay and unplanned readmissions can be broken down by specialty. In the box the number of patients is shown that are deceased, that had a long length of stay or an unplanned readmission. The number next to the box represents the ratio. That is the number of expected events (based on the benchmark and casemix) divided by the actual number of events, multiplied by 100. The color of the box implicates if the deviation of the ratio is statistically significant. (red: significantly above expected; green: significantly below expected).
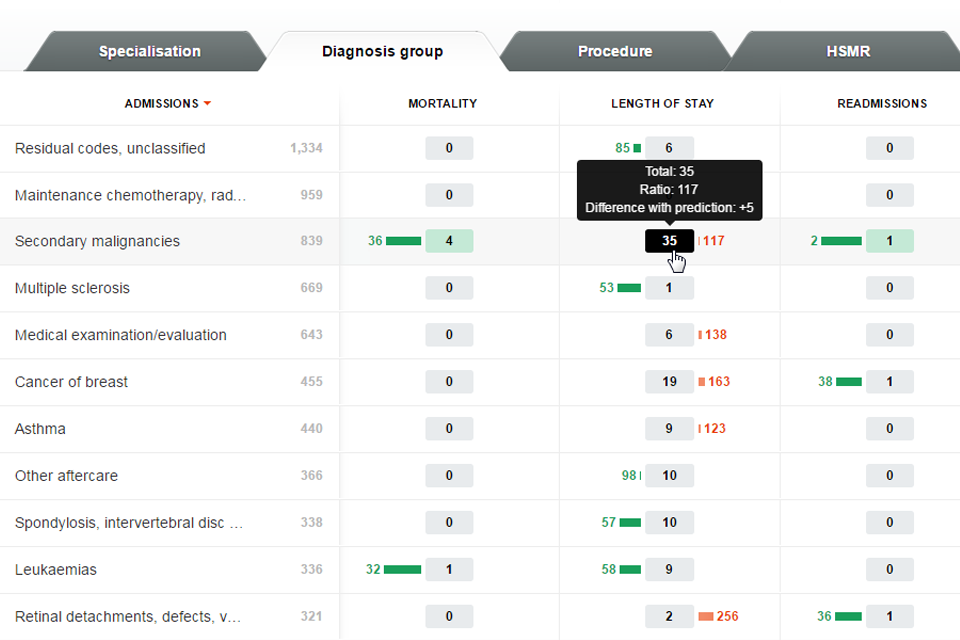
Breakdown by diagnosis
Shows the data of all diagnoses groups.
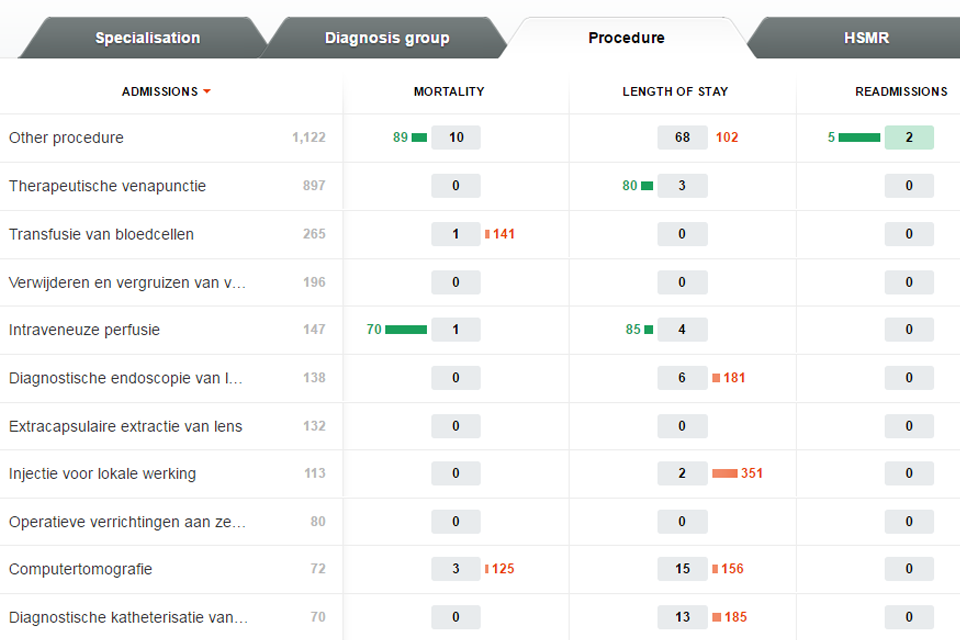
Breakdown by procedure
Displays details of all procedure groups.
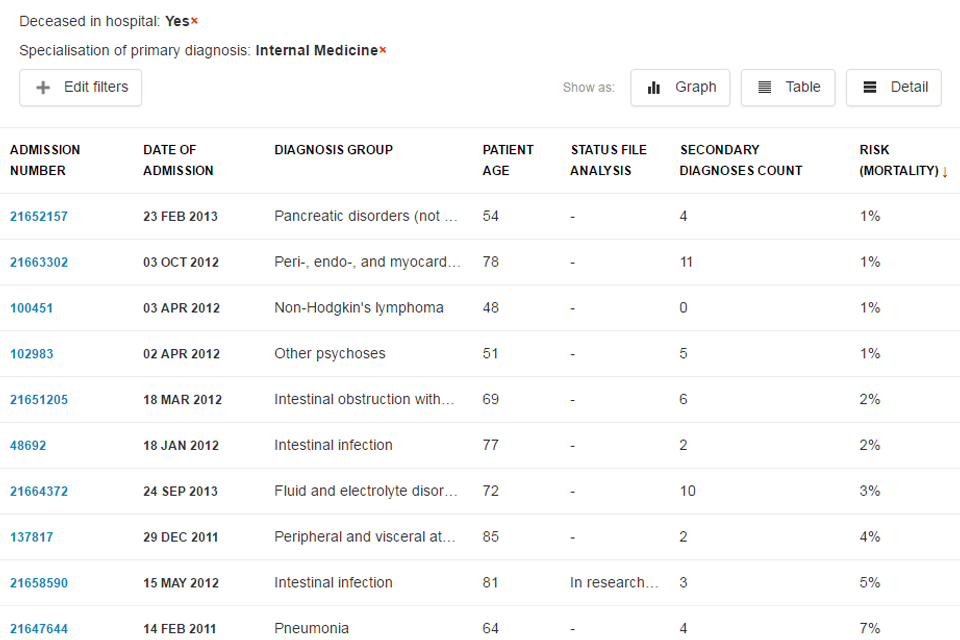
Overview of all admissions
A list of admissions is presented, based on the filters. Behind every admissions the individual risk is shown.
Sort on the risk, and select low risk patients that are deceased, had a long length of stay or an unplanned readmission. In those admissions it is possible to find complications or other underlying reasons for the adverse outcome.

Detailed view of admissions
The list of admissions can be viewed in detail. More information is shown for every admission, such as the secondary diagnoses.
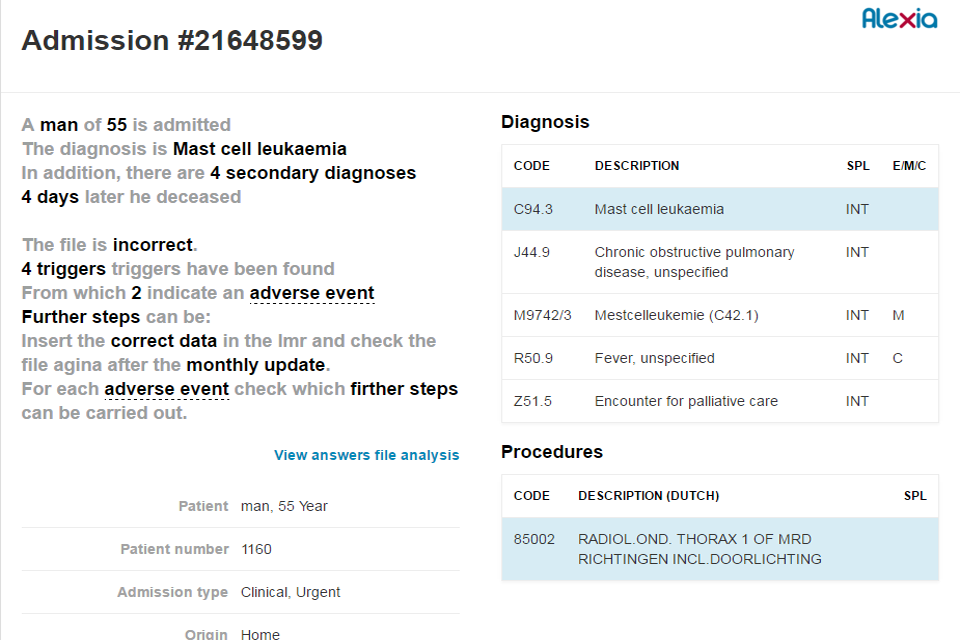
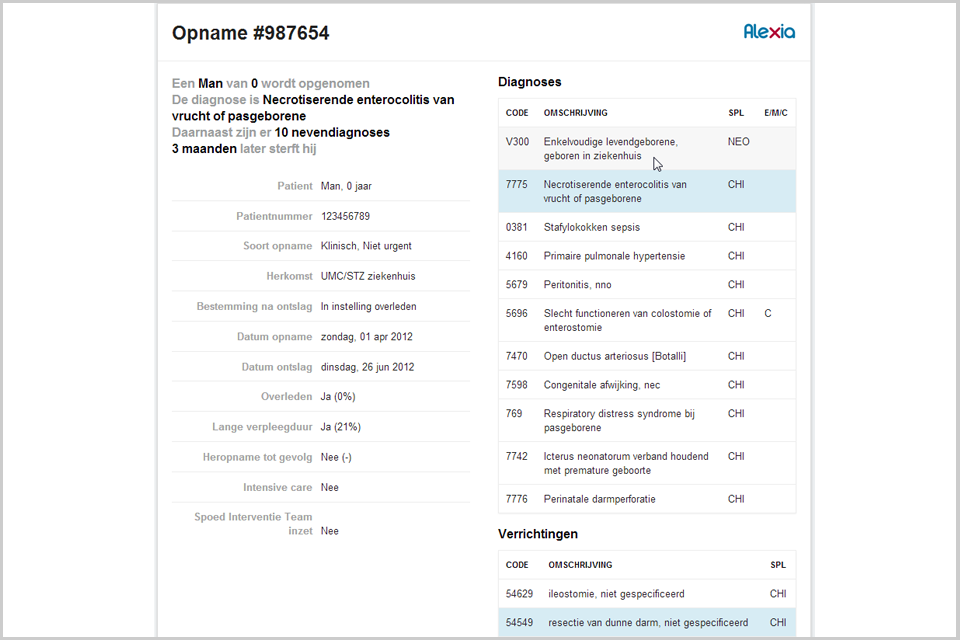
Admission details
By selecting a specific admission, a detailed view of the admission is shown.
Data
- Type of admission
- Length of stay
- ICU admission
- Rapid response team
- Primary and secondary diagnoses
- Primary and secondary procedures
- All previous admissions of the patients
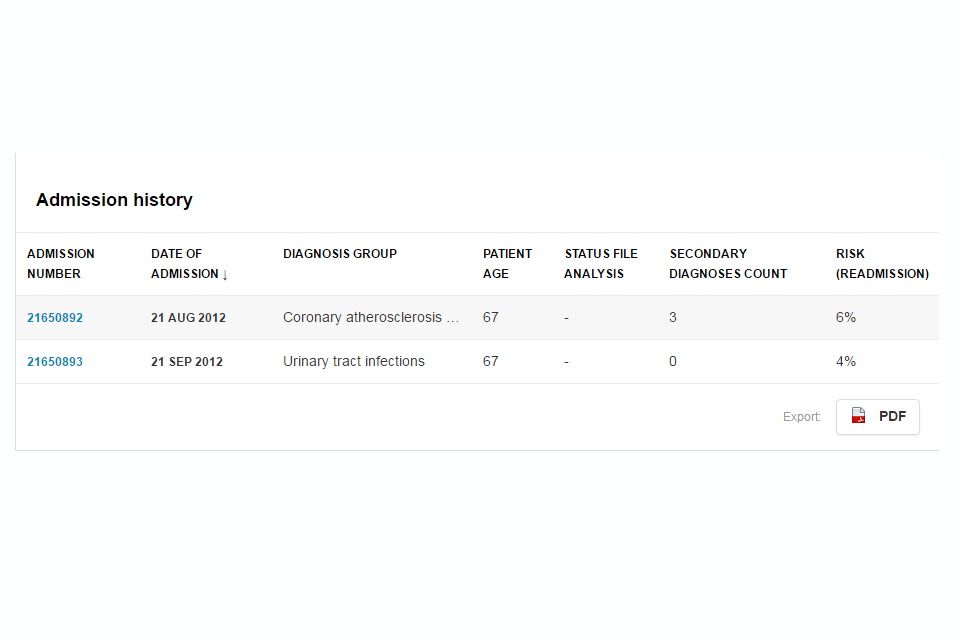
Patient history
Show all the previous admissions of the patient
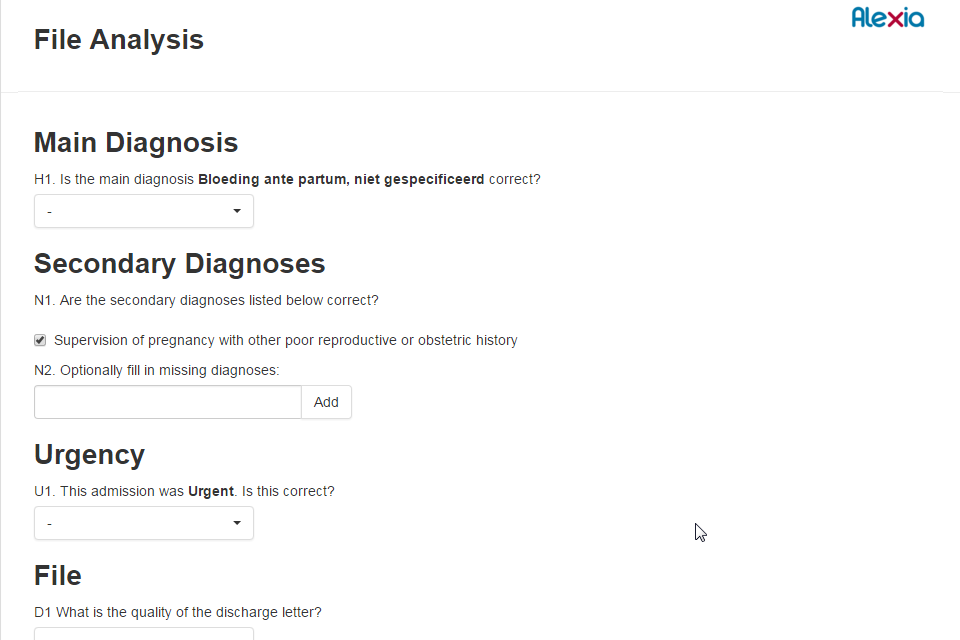
Case note review
Select admission for case note review. This can be performed in Reflex.
Triggertool
Fill out the triggertool form when applicable